Wednesday, September 29, 2010

What makes for a good inference?

What is inference and why does it matter?

Data Proliferation [source]


We live in a sea of data and information, but rarely does information
translate to  insight! What the  domain experts look for the most is the
ability to make better decisions based upon insights (beer and diaper
story comes to mind -- although it is an urban legend). A better
example is the economist experiment:

  • Offer A: online Subscription for $60,
  • Offer B: Print only subscription for $120
  • Offer C: Print and online subscription for $120

The insight here was that people will switch to print+online offer as
it is perceived to be the best offer. The key is in providing a set of
choices that results into the desired outcome.

In analytics, we try hard to find such insights and help influence
business decisions. However, very frequently the decisions taken are
very mundane -- Should the large size of the cereal box be 20oz or 21oz?


What are commonly used inference methods?

So, how do analysts go from data to insights?
If you come from statistics background, you would fall back on the concept of
hypothesis testing. You propose a hypothesis, try to find the odds
that the hypothesis holds (frequently the null hypothesis being
rejected). The idea is simple but elegant. Suppose you observe a
person who is 99 years old and then try to answer the question: what
is the expected life span? Clearly you can't say its 99 years as you
don't know if that is an outlier or the norm.

What are some of the drawbacks of statistical inference methods?

Hypothesis makes this approach precise -- it can tell you how the odds
change as a function of the number and type of your
observations. However, a lot of us frequently forget about the
assumptions that go into hypothesis testing and as a result the
conclusions may not be reliable (Does your data really have normal
error distribution? Is your data really independent/uncorrelated as
required -- for example if your data is some type of timeseries it
probably has a fair degree of autocorrelation).


I have an interesting anecdote for this. We were testing a set of
models which had a couple of hundred coefficients. We found that about
5% were flagged as non-zero with a p-value of 5%. If you were to
blindly accept all the significant outcomes based on the p-values you
would lose the big picture. 5% p-value says that you can expect 5%
type-2 errors (reject the null hypothesis incorrectly) and that is
what we found in the data. But, wait that is not sufficient. We also
checked the values and found them to be close to zero (0.1, 0.05 etc)
and hence it made sense to conclude that the current formulation
wasn't finding any significant coefficients.

Below is another example for using a t-test on two populations. This is usually used for determining if there are significant differences between two datasets. This could have many different applications -- clinical trials for testing the efficacy of a drug, A/B testing of offers both in the online and offline worlds etc.

The simulation below demonstrates that it is possible to conclude incorrectly if the results are based on a single statistical measure (the p-value). Confidence interval provides yet another measure that has the nice property of convergence as the sample size increases.

First example is on a simulation of randomly generated uniform [0,1] (or U(0,1) random variables. The second example uses standard normal (N(0,1)) random variable with mean = 0 and variance = 1.


CI and p-values for simulated data


We generate two samples from the same population (uniform [0,1] i.i.d
random variables) and then run a t-test with the null hypothesis that
the means are equal. A low p-value (<10% or 5%) would cause us to
reject the null hypothesis and conclude that the means are likely
different.

As you can see, even as the sample size increases the p-value tends to
bounce around (including some cases where it dips below 10% threshold
-- not shown here). On the other hand the confidence interval does a
much better job at concluding that they are identical. Notice how
quickly the spread narrows.

Now the same experiment run on N(0,1). I have added points for the sample means, which are indeed close to 0 (the expected value).


If we pick a p value threshold of 10%, we will reject the null
hypothesis in some of the cases. Apart from the chance occurrence,
when you have large sample sizes, the variances could be small enough
to give you this result.

So, how do I know this is indeed the case? I used random number
generator to generate two sets with the _same_ parameters (uniform
random numbers U[0,1] in the first example and N(0,1) random numbers in the second)

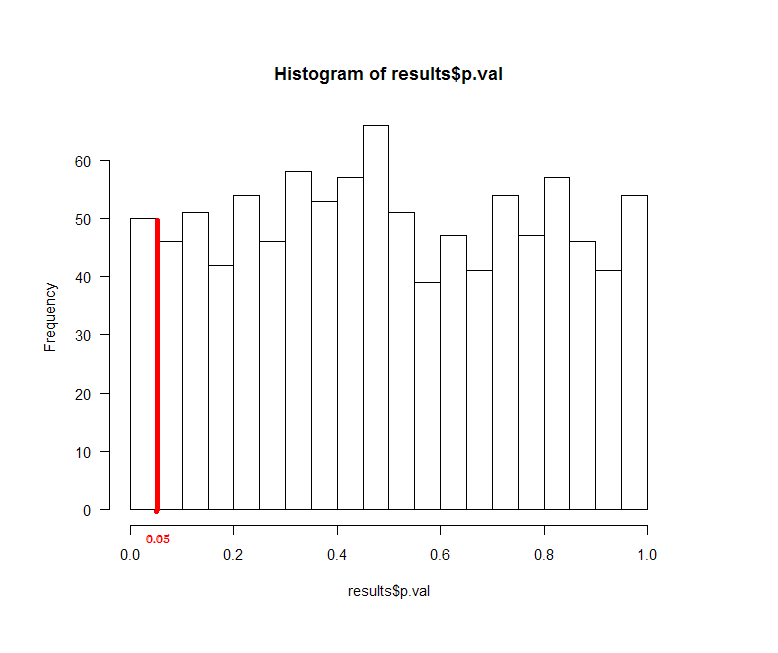
Next, I ran a simulation where I generated two independent vectors of 1000 N(0,1) variables and computed the p-value and confidence intervals. The figure shows that the confidence interval and sample mean (yellow) estimate is indeed clustered around 0, but the p-value (green) is bouncing around quite a bit. Subsequent figure shows the histogram of the p-values from the same experiment. As expected, we find that 5% of the p-values are less than 0.05!


How can you improve inference techniques?


What we need is higher degree of confidence in our
inferences. However, since we are reducing a large amount of data to a
few outcomes, it becomes necessary to look at multiple things. As one
gains experience, it is easy to refine the key metrics and focus on
the right subset.

1. Most statistical packages (R, SAS) report a number of useful
statistics when estimating a model -- please understand what each of
them mean and look at them carefully. Look at the p-values,
t-statistics, AIC/BIC values, deviance values, reduction from null
deviance, degrees of freedom etc

2. The model estimation is influenced by data and in some cases more
so by some data points than others. Once you understand this, looking
for outliers and leverage (shows relative contribution of the data
points to the coefficient estimates) becomes the norm.

3. Confidence bands/intervals: This gives you a much better feel for
the possible range of values that the outcome can take. For example,
in an election if one of the candidate is leading by 55% vs 45% and
the margin of error (difference between the midpoint and one of the
ends of the confidence interval) is 6%, then the results could reverse
the direction during the final outcome.


4. Withhold some data from your training set and run the estimated
models on this withheld set to see how well it can fit that data --
this is one of the most important test you can run to ensure the
validity of your model. There are many creative ways of doing this:
cross-validations, leave-one-out method, pick specific data-points for
withholding etc.

5. Bring in the problem context at hand to see what are the important
problem related metrics that one can use. In the retail sector, the
most important metric one can use is the forecast accuracy for the
demand or the sales. In the clinical trial area it could be a
measurement of related outcomes -- longevity, survival time etc.

6. Find out the basic approaches advocated by the academic or
industry practitioners (and Google search is your friend!) -- see what
works for others and what doesn't. If nothing else, it will expedite
your model development and validation process.

7. Train models on simulated data. This is a great way to ensure that
there are no coding/interpretations issues. You should be able to
simulate fairly complex data and should be able to recover all the
driving parameters that went into the model. In fact, this can serve
as a very good automated test suite to validate model enhancements.

Friday, September 3, 2010

Technology and Business

Why worry about technology?

Througout our history, technology has been a big driver at increasing productivity. Apart from that, it can sometime drastically change the way we do things. For example, horses were the best mode of transportation mankind had for nearly 3000 years until the Model-T came by (railroads powered by the steam engines if you look back).

source
Horse-Carriage based firestation, circa 1901 MA source


The latest evolution in technology is using computers and internet to better conduct business. Thanks to these technologies, one can do many more things these days and do it from almost anywhere (thanks to the now ubiquitous smartphones). This enormous computing power and universal accessibility allows us to do many more things very effectively. The down side is that people become addicted to their devices (crackberry) and could negatively impact their social relationships.

If one is afraid to pioneer, someone else will and the results could
be catastrophic. Pioneer doesn't necessarily being the first to adapt,
but it does mean adapting it quickly to one's own unique
circumstances. Technology landscape is littered with such examples,
Microsoft with Word, Excel and Internet Explorer, Apple with their
first GUI based operating system (Xerox Parc was the precursor),
online auctioneer EBay , FaceBook

Who are some of the innovators in leveraging technology?

When it comes to using pure software technology, following companies stand out for what they have done and how they have revolutionized their respective businesses (There are a large number of startups that are innovating very rapidly, to be visited in a future post)

Google: They pioneered the concept of quality vs quantity and managed to keep the costs extremely low by hiring the very best people and using commodity hardware. They were so successful at this that they forbid any employee from revealing the number of computers they had in the datacenters -- currently rumored to be around one million. They ended up inventing new paradigms in computing to allow for the internet scale (map-reduce technology for robust distributed storage that also doubles as fast retrieval mechanism -- Hadoop is the open source version of this technology). On the front end, they evolved a very rich user experience using AJAX (via javascript and python)

Googleplex, Mountain View, CA source

Paul Buchheit, an early Google engineer and initial author of Gmail, has interesting take on Google: On Gmail, AdSense...

Amazon: In many ways they are similar to Google and have been a pioneer in using service-oriented-architecture (SOA). This allows for multiple business logic/analytics components to be decoupled. For example, on a typical amazon webpage different services serve out the product details, pricing information, availability/inventory information, reviews information. This allows them to tweak their webiste very quickly (granted that their UI is not the sleekest, but for that you need Apple type focus). They are bringing this same level of rigor in their order fulfillment and distribution centers. Their technologies has spawned a new dimension in current computing -- cloud computing. You can store, manage data, and run application on on-demand hardware, and cheaply.

Interesting article describing the culture and innovation at Amazon.
An interesting look at Amazon.com's history

Netflix: They have been using technology to improve the customer experience of enjoying movies. They started off by leveraging the postal service as a delivery mechanism, but the bar-coded envelopes with DCs located in all major areas was all possible due to technology advances. Their innovative usage for movie recommendations and now streaming directly to the computer/TV ensures their technological and business dominance. Hollywood vidoe has closed and blockbuster is on the verge of closing. Note that blockbuster tried very hard to copy netflix and were innovative enough in trying to use their physical store footprint. However, netflix advantage was too much! Netflix achieves by cultivating a culture that works well for them. For example, their vacation policy is to take as much vacation as needed :-)

UPS: We seldom realize how the commercial shippers have changed the landscape. Remember the time when you placed a mail order and then waited...and waited to recieve the shipment. Providing all the data online and through the web meant that users had visibility, but more importantly that data allowed them to plan their logistics and fleets in almost real time. They were able to look ahead use predictive analytics in a very efficient way. They got so good that they can manage supply chain for some businesses!

Samsung: 20 years ago almost no one knew about Samsung in the US. However, they decided to make "great and relevant design" as the center piece of their long term strategy (starting in 1995) and have managed to become the leader in many areas (As of 2010, they have the largest marketshare in LCD television in the US, well ahead of Sony). Their pairing up with IDEO, establishment of a large scale design institute in Seoul, and establishing many other satellite design facilities allowed them to execute on the vision. They also ended up devising new ways of managing design, conception, prototyping, and production-rollout. A pointer to this change is the number of design awards Samsung has won internationally including the Industrial Design Excellence Awards (IDEA) -- more than 100 since 2000. [Ref: BusinessWeek; 12/6/2004, Issue 3911, p88-96]

They have managed to grow their global revenues 6-fold in the last 10 years or so from $20B USD to over $120B USD, actual trajectory charted below:

SAMSUNG: Revenue and Operating Income Growth
[Graph produced in R]

  
How to best use technology?

Technology has to be understood and then utilized. Startups are incubators for many new ideas -- some will succeed but many will also fail. So, there's always something new to try out . We should always be on the lookout for new ideas and ways to test them quickly and cheaply (fail fast philosophy). Below are some thoughts
  • Improved/faster access information enabling faster decision making: Reporting and BI are supposed to deliver this, but we need to be thinking about newer ways of surfacing this information. Traditionally RDBMS/EDW with SQL have been the main tools, but with internet-scale data we should think about newer technologies and access mechanisms (Map-Reduce, noSQL options, distributed computing on commodity hardware etc.) We will look at this landscape more closely in a future posting.
  • Using technology for streamlining processes and increasing productivity
  • Using technology to learn about the website, customers preferences and making changes -- this is usually achieved by the web-log analysis or running various A/B tests
What to watch out for?

Technology promises many gains, but the field is rife with projects that don't deliver, are over budget, or simply not efficient. In most cases this reflects lack of understanding and using technology than the technology itself. In other words, we need to adopt some of the same mindset as the succesful software companies. Here's one way of trying to doing it:
  • Startup vs large company: what works in a startup may not apply to a larger organization for a variety of reasons (e.g. mission critical systems have different requirements than a web2.0 website). This is an important consideration in the choice of tools and technologies.b
  • Prototype vs Production: it's not a question of either, but of doing both effectivelyl. Prototyping allows you you to lay out proofs of concept quickly, but then taking it to production quality takes a much bigger effort. The best analogy is an architect's rendering vs a structural engineer's detailed plans for a building. In order to make this effective, you need people who are comfortable doing both in an interchangeable way -- I think owning the process from concept, to prototype, to productization leads to much better outcomes. The reason why productization is a bigger effort is because of additional requirements around performance, scalability, integration with other systems, other requirements such as security/authentication.
  • Software development and testing methodology: As a saying goes, bugs and lines of codes go hand in hand. Instead of fighting the bugs, it is much better to adopt methodologies that will minimize the introduction of bugs (modular architecture, decoupling of components such as business logic, presentation layer, and data interfaces), methodologies that will catch bugs quickly (iteration on full system design), and using tools/techniques that help with this productivity (automated testing ensures that the software is tested as soon as it is written, bug tracking systems to have very good visibility into the number of defects and overall quality of the software)
  • Choice of software and hardware tools: There are many options available with varying degrees of freedom (underlying code you can change), varying total cost of ownership (TCO), various stacks (open source LAMP stack, java stack, MS based .NET or VB stack). There is no magic bullet and we have to be guided by able and experienced architects in the choice of these tools. From the business side, we should help the process by specifying the acceptable behavior based upon business needs -- e.g. report should load in under 5 seconds, it should support at least 50 simultaneous business users, the peak load occurs on Sun night and is X units of jobs/work started
  • People, people, people: The quality of people doing work and leading the effort is by far the most important component. If you have the best people and _trust_ them, they will tend to deliver above expectations. Some of the processes and reducing interruption from non-development parties could aid this process too. I am a big believer in individual empowerment, good incentives, and communication to generate superior results. I think that spending time in understanding individual strengths, project needs (for matching the right people) and structuring the team are very valuable in growing a productive team.